House of
Geiger: The 3D-printed enclosure for the Geiger
Counter somewhat resembles a house or barn, hence the whimsical name. I
was not able to visualize how to fit the four sub-boards into a project
box. So I decided to start on an enclosure by constructing a basement
for the Geiger
PCB, the board that includes the Geiger-Müller tube and associated
circuitry. Next I
added
a first floor for the microcontroller board. At this point I
realized it would be possible to secure the first floor to the basement
by making a tube cover (slotted blue piece in photo) to fit over the
top of the ground
floor’s baseboard, i.e., its front edge. A small signal conditioning
circuit board occupies the second floor. That component’s
scaffolding is hidden from view in the photo, and not by
accident. Finally, the display screen (skylight) and input
pushbutton (air vent) attach to a separate panel that is caulked, i.e.,
glued, to
the
roof.
Variants of a popular open source Geiger Counter
board may
be purchased from many sources, either assembled or in kit form. The one used in this project came
assembled for $33.47 plus a few dollars shipping. My only complaint
is that I couldn’t find documentation for the tube. It is
marked J303ß. I did find a datasheet for the J305ß, which is probably
similar. My second only complaint is that the tube was too short for the spacing
of spring clips intended to
hold it. I had to move one of them, and solder a jumper wire from the
repositioned clip to its original
foil pad.
Project
components: The Geiger Counter PCB includes a
small speaker which makes the familiar clicking sound when particles
are
detected. It also has a headphone jack and an on-board pin header to
convey
the pulse signal externally. That is where the fun begins—Just
listening to random
clicks produced by
background radioactivity tends to lose interest after a short time.
I had a couple of ideas in mind before
starting the project. One was to use a small color OLED as the display
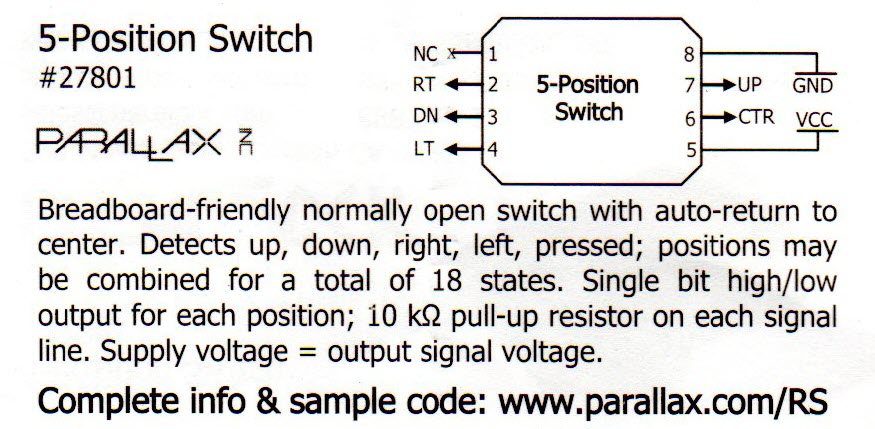
device, and a 5-position pushbutton switch for input. A few years ago,
when
Radio Shack was closing US retail stores, I purchased odds and ends
on-sale, hoping to find interesting uses for them someday. One
such purchase was a switch that looks like a pushbutton but behaves
more like a joystick. It is not a joystick, but a 5-position
switch.
The package insert is reproduced above. My thought was that the
combination of OLED
and multi-position switch could be made to function similarly to a
touchscreen, not the same exactly, but close enough to construct a
numeric calibration
option without the need for a keyboard.
Another preliminary thought was to
include images as part of a ‘quantum coin toss’
option. I will describe this idea further below, but its significance
for the planning stage was that the application would need
memory—bitmaps
consume memory. I started playing with an Arduino Uno and also tested a
Nano,
but encountered trouble on two fronts. One was the bitmaps memory
issue. The other problem is harder to describe. I am not sure that I
understand it completely, but it had to do with the limited interrupt
pin
assignments that are available in these architectures. In any case, the
answer to both problems was to substitute an Arduino Mega 2560. Teensy
would
also
have worked, but the project provided a good excuse to explore a new-to-me
platform.
Microcontroller
interface:
The 1.5 inch color
OLED (this one) supports only SPI
(Serial Peripheral Interface)
connectivity.1
I have wondered why 0.96
inch monochrome OLEDs include i2c support
(Inter-Integrated Circuit serial bus, pronounced
‘i-squared c’), while the
slightly larger color ones are SPI only, at least
those I have found to purchase. In the original Uno-based
exploration, DIO pins 4 - 8 were assigned to SPI, reserving pin 2 for
interrupt input. After changing
to the Mega platform and a different interrupt pin, I left the SPI
assignments as they were.
The Geiger Counter’s output
pulse was a bit messy and also variable. To condition it for input to
the microcontroller I ran it through an inverting Schmitt trigger to a
one-shot (diagram above). Output from the one-shot goes to one of the
Mega’s additional interrupt-capable pins (#18). Consecutively numbered pins 22 - 27 were
assigned to the 5-position switch, in order to make use of a
space-saving double-row
header for the physical connection. SPI and pushbutton pin
assignments are more-or-less arbitrary. However,
pin numbering in the sketch (software) must
correspond to the scheme actually used for connecting devices (or
vice-versa)—this aspect of numbering is not
arbitrary.
 Heads
or
tails: It is possible to purchase an attractively
packaged pre-made Geiger Counter, for example this one,
for not much more than the cost of
this
project’s
parts. The main
reason to build or assemble a Geiger Counter is to personalize the
design, in other words to express whatever crazy ideas
come to mind. One such idea was to include a graphical coin toss
option. This idea was partly inspired by the resource described on this page,
which dates from 1996 (impressive!). I had played with the ‘physical
random numbers’ idea previously, but in a project that used electronic
white noise as the source of randomness (write-up here).
Heads
or
tails: It is possible to purchase an attractively
packaged pre-made Geiger Counter, for example this one,
for not much more than the cost of
this
project’s
parts. The main
reason to build or assemble a Geiger Counter is to personalize the
design, in other words to express whatever crazy ideas
come to mind. One such idea was to include a graphical coin toss
option. This idea was partly inspired by the resource described on this page,
which dates from 1996 (impressive!). I had played with the ‘physical
random numbers’ idea previously, but in a project that used electronic
white noise as the source of randomness (write-up here).
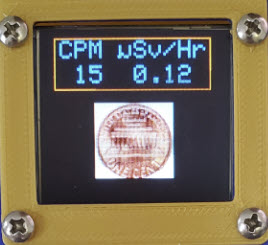
Pressing the pushbutton in the ‘down’ direction at the home screen
causes either heads or tails to display for one second, momentarily
replacing the radiation warning graphic that normally decorates that part of the display. By the way,
the radiation image caused some OLED burn-in that can be seen in the
photo
(left) as bright spots on the coin image. It would surely be better
to display multiple bitmaps (or variant forms with contrasting colors)
instead of one constant image, to reduce or prevent burn-in.
The coin toss works as follows. In the Arduino Mega
platform the smallest grained timing function has a resolution
of 4
microseconds. To be precise, the built-in micros() function always
returns a multiple of 4 microseconds. Thus, elapsed time in
microseconds (modulo 8) can be mapped to
parity.2
Since the timing of ‘clicks’ (atomic decay events)
reflects nature’s randomness, I refer to this option as a ‘quantum coin
toss’. Now a curious observation... We humans are not wired to detect
randomness. On the contrary we tend to expect randomness to produce a
sort of short-term balance. A small number of heads or tails should
even-out, we think. Thus, it is easy to become persuaded that the coin
toss
option does not
behave randomly. To verify the process, or rather to ascertain whether
in fact the coin toss is fair, I left the Geiger Counter powered-on and
detecting background radioactivity around the clock for approximately a
week, yielding 44,720 tosses.3 (No doubt this side-study
contributed to the OLED burn-in problem.) I then ran the NIST
random number statistical assessment tool ‘assess’
on the data, the same suite of tests as was used in
the
aforementioned white-noise ‘physical random number’ project.
This weeklong accumulation of data passed 145 of 147 ‘non-periodic template’
tests and the dozen or so other statistical sub-tests that make up the NIST
suite. The
final ‘Universal Statistical Test’ requires a considerably larger
sample size, which would have been desirable, but based on
completed test results, I conclude that this particular implementation
of nature’s coin toss is
fair.

Calibration: Counts
per minute reflect the Geiger-Müller tube’s sensitivity and possibly
also how it is packaged. To convert counts to physical units (radiation
dose) it is necessary to calibrate the counter. Even if calibration
were not needed it would still be fun to construct this option because
it makes use of all five button press directions: north, south, east,
west, and center.4
On first entering the calibration option the digit to the left of the
decimal point is highlighted. Pressing up (north) or
down (south) increases or decreases this digit’s value, with rollover between
‘9’ and ‘0’. Pressing left (west) or right (east) moves editing to the digit on the
left or right of the one that is currently being edited. When editing
is complete, pressing center (pushing the button straight in) causes the ‘Save and return’
option to be highlighted. On accepting this option (another center press) the
edited value takes effect immediately, and is saved to EEPROM to be
restored whenever power is
cycled. To exit the calibration option without saving, press ‘down’ to select the bottom option, and then center-press.
There are two ways to ascertain what the
calibration value should be—well
probably more than two, but two that I know about. The first is to use
a measured quantity (source) of radioactivity. Precisely position
the source in relation to the G-M tube and record counts per minute over a
sufficient interval. Finally, subtract out the background and apply
some seriously imposing
formulas to the balance. The other way is to place the unit in the same location as a calibrated
(trusted) instrument and compare readings of the same source, e.g.,
background radioactivity, again over a suitable time period.
Clearly the latter method is less challenging, and should normally
suffice, given that the project is intended for
entertainment, not for scientific work, and most assuredly not for use in a
radiation safety application.

 Other
menu options: The
‘Last Minute’ option displays a histogram (photo left) of
second-by-second moving average counts per minute, with the current
time’s count at the left (0-seconds) and the count for one minute
prior at the right-hand end (-60s). This same graph can be displayed for two-seconds from the main screen by pressing ‘up’.
Other
menu options: The
‘Last Minute’ option displays a histogram (photo left) of
second-by-second moving average counts per minute, with the current
time’s count at the left (0-seconds) and the count for one minute
prior at the right-hand end (-60s). This same graph can be displayed for two-seconds from the main screen by pressing ‘up’.
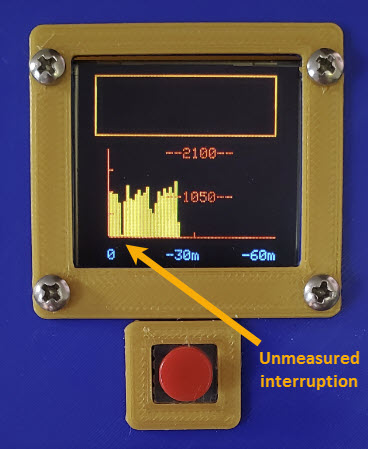
The ‘Last Hour’ option is analogous, displaying a histogram of
extrapolated counts
per hour from the present (leftmost) to one hour ago (rightmost).5
Exiting from menu selection resets counters to zero. When
this
happens a bar is skipped in the hour graph, because the amount of time
spent in the
menu context was not measured. Thus, a missing bar in the ‘Last Hour’
histogram (photo right) represents a time interval of
unspecified duration. Bars to the right of the blank represent data at
least as old as indicated, but possibly older.
The 1½ inch OLED screen does not accommodate much in the way of detail.
To compensate for inadequate space, vertical axis tick values are shown
in the middle rather
than the left edge of the graph, where they would subtract from the
space available for plotting the graph. These reference values are scaled
according to the maximum count recorded during the time period shown.
For example, if say 40 counts are detected during the minute to be
graphed, the ‘Last Minute’ scale doubles to 70. Similarly it can expand
to 3 × 35 or 4 × 35, etc. The base value ‘35’ can easily be changed to reflect different detector sensitivities. It is a named constant in the sketch.
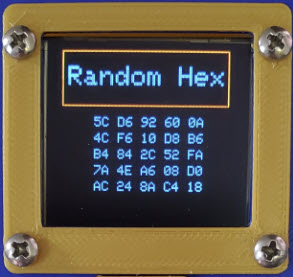
The ‘Random Hex’ option displays a table of random numbers in hex
format. As previously noted, random data
harvesting that relies on background activity is slow, so time is needed to fill out the table. If examined
soon after startup, the table will have
only a few non-zero entries. Consecutive zeros to the end of the table
represent unvalued cells, except by extraordinary coincidence! Perhaps dashes
would have been better for unpopulated cells.
In truth a small table of random bytes
is of little
use or interest, but something had to occupy available vertical
space in the options list! That said, I
did use the option myself, albeit artificially. Before
restoring a calibration number from EEPROM it would be good to know if
a valid calibration value has been stored there. Otherwise EEPROM
might contain only junk, in which case a
default constant should be used instead. So I added a four-byte key
to sign the stored value. That stored constant key came from the
program’s own random generator—a meaningless but appealing self-reference.
Serial
data: In order to study long-term
background radioactivity, or for
that matter any source of activity, it is necessary to capture data for
analysis. To do this, connect the device’s USB jack to a computer USB
port, the same as when programming the Arduino. The counter’s
serial data stream can be displayed via the Arduino
IDE’s serial monitor or PuTTY or Termite or any such serial COM
utility. Textual data can be captured to the
clipboard or saved to a file. From there the data can be imported to a spreadsheet
application or to statistical analysis utilities, and so forth.
RFC1201:
A company called GQ Electronics sells
Geiger Counters in several models, and offers their GQ GMC Data Logger application
software for download. The interface specification is an RFC.
It is possible to register GQ
Electronics Data Logger software, although I have not done so. The
application is almost surely designed for interfacing with the
company’s own Geiger Counters, but can be interfaced with other units
as well, at least partly so. The project Geiger Counter’s
microcontroller is coded to respond appropriately to documented start
and stop heartbeat commands: <HEARTBEAT1>> and
<HEARTBEAT0>>. These commands start or stop the real-time
upload
of counts per second. As this feature is implemented in the present
project, the Geiger Counter sketch transmits a constant as the first
byte and the count (up to 255) as the second byte of the heartbeat, not
a 14-bit datum as specified in the RFC, but good enough—I hope never to
detect more than 255 counts per second with this counter! In any case,
the format works. Received ‘heartbeat’ counts effectively enable graph
and activity
display features of the Data Logger, with limitations.
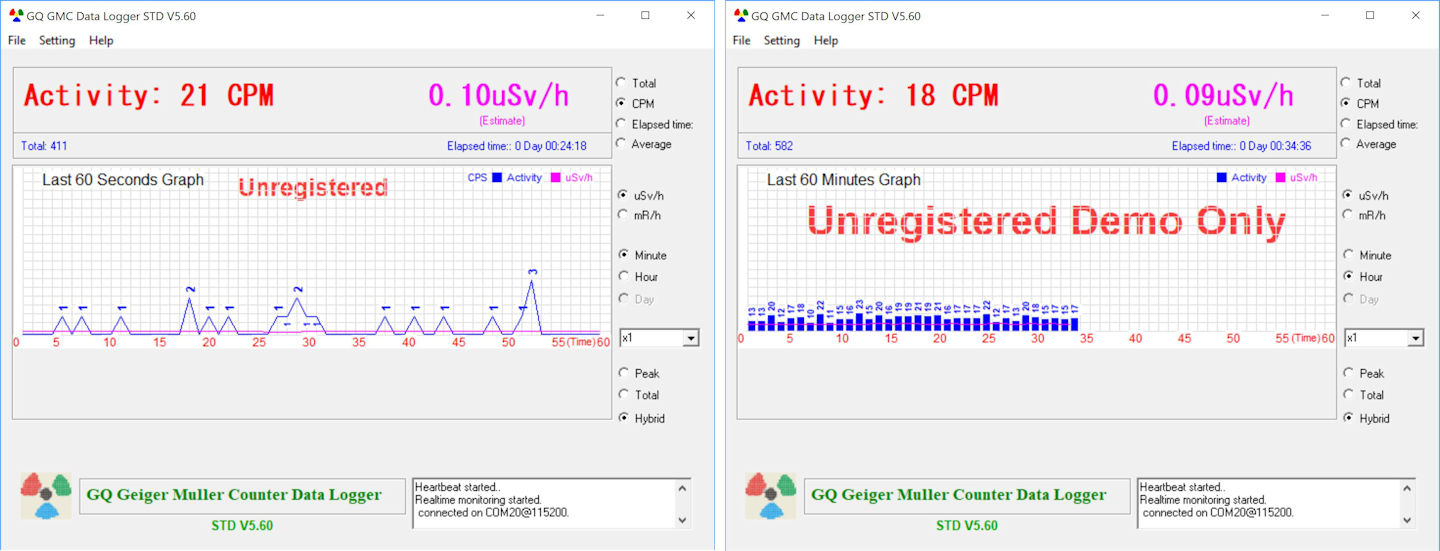
In the above screen captures, the Data Logger
application was receiving and displaying data from this project’s
Geiger Counter, not one of the GQ Electronics models, which are
admittedly much nicer. But as I said there are limitations. My sketch
(download link below) does not honor a time sync request from Data
Logger, not yet anyway. Thus, after about an hour the application
displays the message “Time Sync Failed! Task rescheduled within 30
seconds.” However, the program continues to receive and display counts.
Another caution is that the displayed ‘estimated’ dose value does not
reflect the sensitivity of the unknown counter that was interfaced.
Thus the displayed estimated dose is not valid in this context. I do not know if Data
Logger’s dose calculation can be calibrated for an unlisted instrument.
In truth the main appeal of this application was its colorful
appearance. For any sort of meaningful study it would be advisable to
upload raw values, and select a suitable analysis utility from the wealth
of such tools that are available.
Concluding thoughts: The Arduino Mega microcontroller code is
available for download as a zipped folder: Geiger sketch and bitmaps.
Component interconnections do not require a
diagram, as they are documented by pin numbering in the sketch. In any
case
this write-up is not intended as a ‘How to’ reproduce what I did (there
are better models to follow), rather as a story about having fun with
the popular open-source Geiger Counter board. Other similar projects might aim for a more practical or
useful result than the construction described in these paragraphs.
1. Adafruit’s GFX
library (1.4.2) default font does not include the Greek letter
mu.
(Lowercase μ stands for ‘micro’ as in microsecond or microsievert.) Nor
was the character to be found elsewhere in the library’s fonts folder.
Well, there was one font (not sure if it is part of the library or an
add-on) called TomThumb, but I couldn’t get that one to work at all.
Small things are sometimes the most distracting. I spent probably two
days attempting without success to construct a GFX-compatible font that
included the letter mu. But then the realization dawned that mu stands
for ‘mirror u’ (joke). This thought led to a shameless
kludge that consisted of printing ‘u’, then erasing and drawing
pixels to reverse the English letter’s base. And since μ always follows
space
in the display I added a tick at the letter’s starting cursor position
-1 to curve the new left-side
stem, a sure giveaway to any font-sensitive eye.
2. This, of course, says nothing
about possible bias in the mapping of elapsed time to parity. However,
flipping the meaning of the timing function’s mapping, i.e., the
meaning of (microseconds (mod 8) == 0), on successive
invocations of the function should counter built-in bias. I got this
idea from https://www.fourmilab.ch/hotbits/how3.html,
where, in addition to flipping the parity mapping, time deltas are
used—intuitively better, but slower.
3. Only one coin toss can be harvested in a given second by the method
described. No clicks means no coin toss. Multiple clicks in the same
second yield just one toss. Thus, relying only on background
radioactivity, bit-harvesting by the method of this project is
impractically slow.
4. The Radio Shack
#27801 (Parallax) 5-position switch also supports combinations of
directions
for a total of 18 states. However, only primary button presses were
used in
this project.
5. The actual counts per hour (CPH)
value cannot be known until at least one hour has elapsed. Thus, the
CPH graph depicts minute-to-minute estimated rates, computed by summing
CPMs over each second of the preceding minute..
Project descriptions on this page are intended for entertainment only.
The author makes no claim as to the accuracy or completeness of
information presented. In no event will the author be liable for any
damages, lost effort, inability to carry out a similar project, or to
reproduce a claimed result, or anything else relating to a decision to
use the information on this page.