NOAA GOES-16
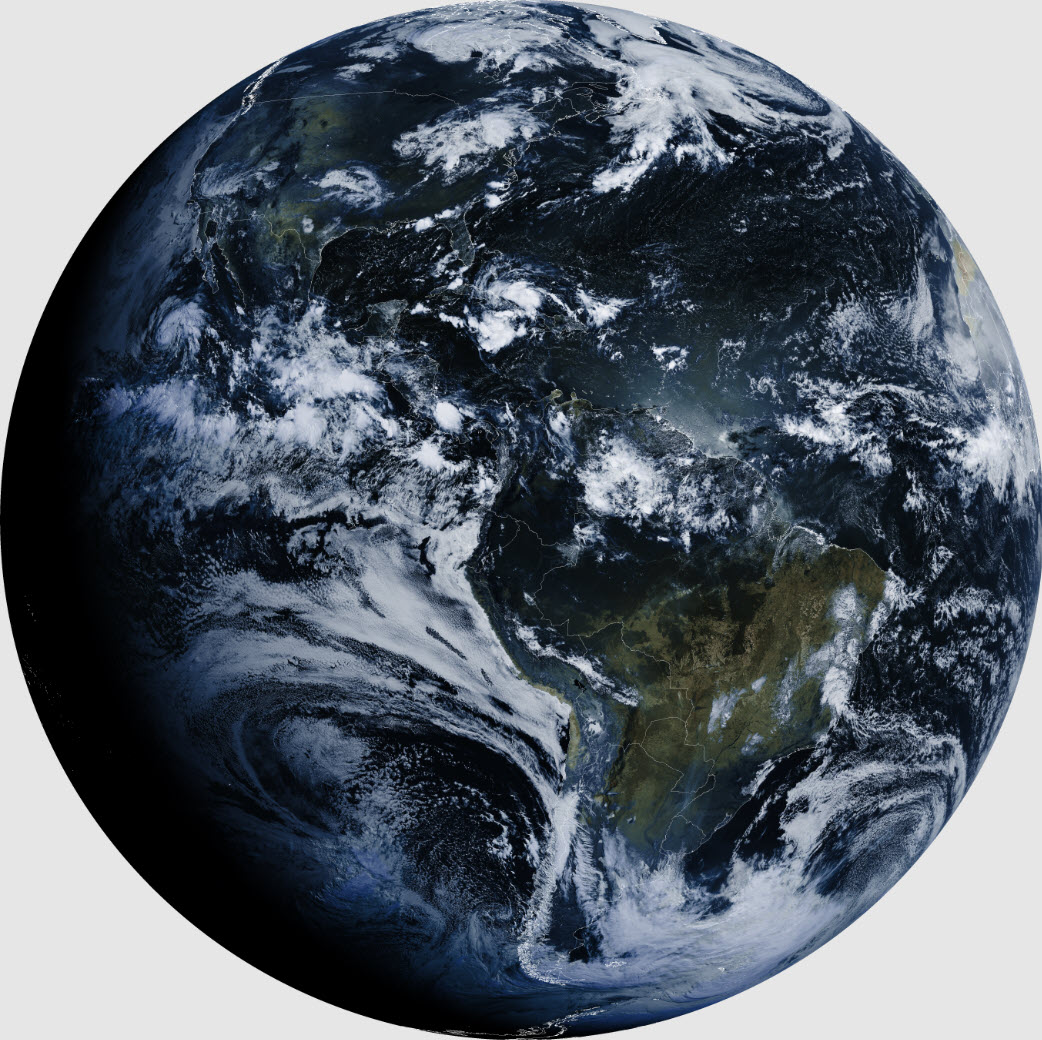
 Getting started: The .jpg image above does not do justice
to the original high-resolution .png from GOES-16. Click the
link and zoom-in to view amazing detail.1
Before describing how this
image and many others were successfully received and decoded I will
briefly recount the highlights or lowlights of my first attempt to
receive GOES-16 in October 2018. A previous owner of our house had
abandoned a
DirecTV dish in the backyard. I kept the steel post and
azimuth/elevation mount,
but replaced the TV dish with one that was said to be good for
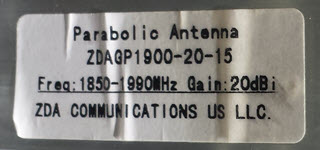
receiving the NOAA GOES satellite. The antenna that I purchased was
manufactured by ZDA Communications, and labeled 1850–1900 MHz, about
200
MHz above the frequency of interest. This first attempt at GOES
reception was doomed, not on account of the antenna, but rather of my
failure to understand or fully appreciate the nature of the challenge.
Getting started: The .jpg image above does not do justice
to the original high-resolution .png from GOES-16. Click the
link and zoom-in to view amazing detail.1
Before describing how this
image and many others were successfully received and decoded I will
briefly recount the highlights or lowlights of my first attempt to
receive GOES-16 in October 2018. A previous owner of our house had
abandoned a
DirecTV dish in the backyard. I kept the steel post and
azimuth/elevation mount,
but replaced the TV dish with one that was said to be good for
receiving the NOAA GOES satellite. The antenna that I purchased was
manufactured by ZDA Communications, and labeled 1850–1900 MHz, about
200
MHz above the frequency of interest. This first attempt at GOES
reception was doomed, not on account of the antenna, but rather of my
failure to understand or fully appreciate the nature of the challenge.
One unusual aspect of this first attempt to receive
GOES-16 was the method of aiming the antenna’s azimuth (bearing from
the antenna to the satellite). I used the satellite tracking program Orbitron to show the time of day that
the sun would share the same bearing as the satellite from my location.
I then
aimed the
antenna toward the sun at that precise moment.
This felt like a clever idea at the time, but it
did not lead to success. Many factors in addition to the antenna’s
azimuth influenced the outcome of this first effort to receive the GOES
satellite.
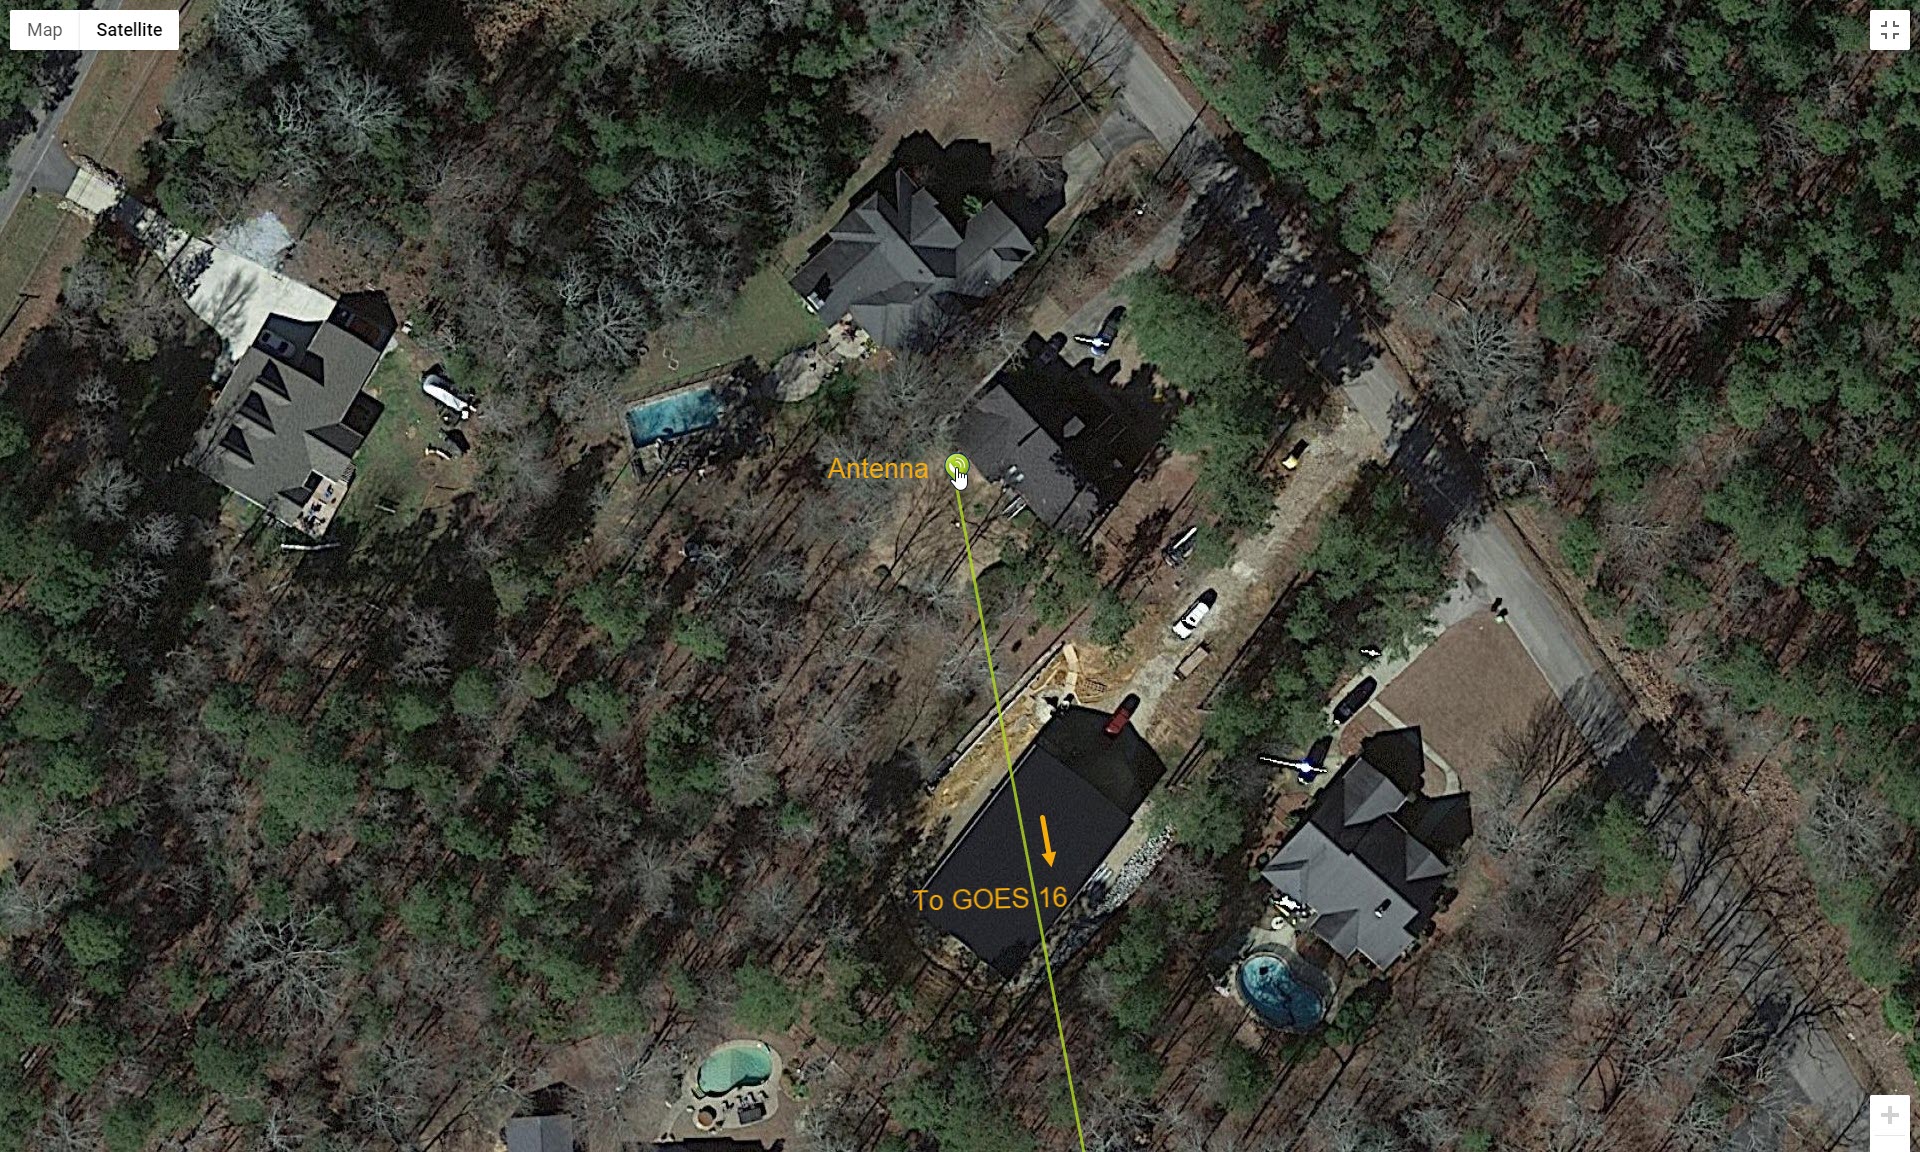
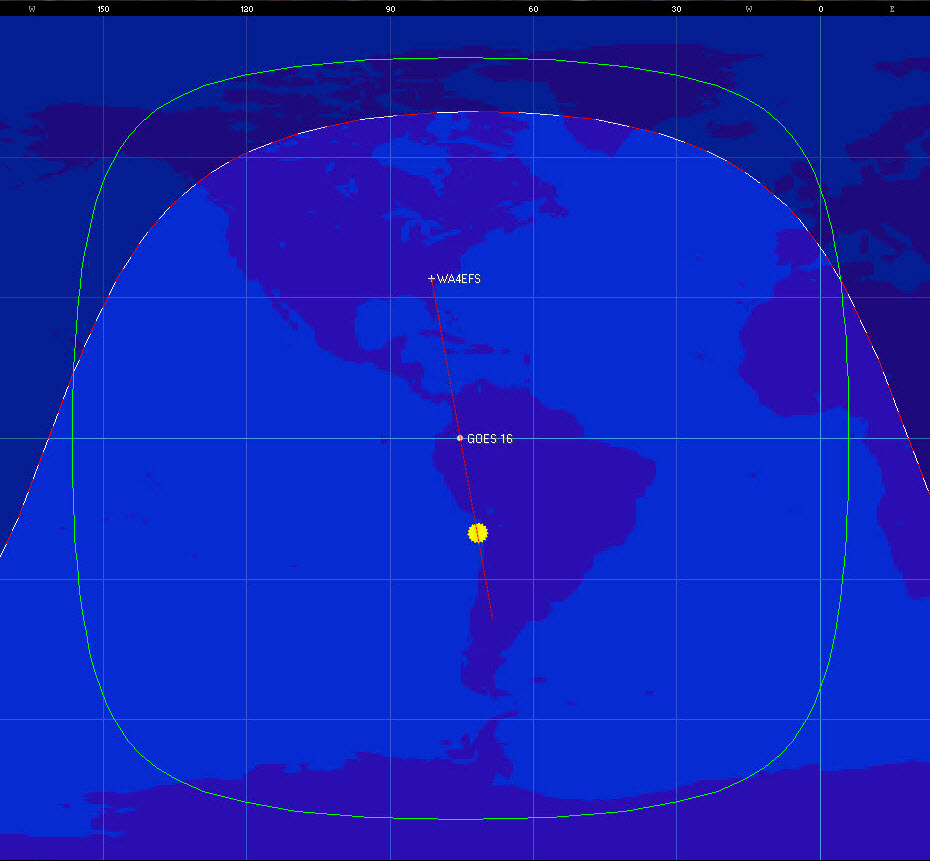
Recently I learned about a fantastic resource
for aiming a dish antenna:
https://www.dishpointer.com/.
This Internet site not only calculates azimuth and elevation
for a selected geostationary satellite, but also
draws a line over a Google image of the location, showing
exactly which way to aim the antenna (photo above).2
Aiming across the neighbor's shed at the indicated point was easier and
surer than using a compass. Moreover, there was no hurry, because
unlike the sun, the shed was not moving.
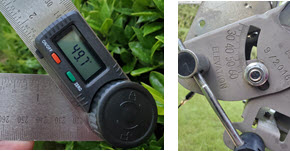
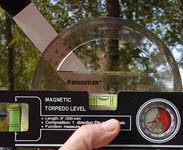 To adjust antenna
elevation angle, I used essentially the same procedure in 2018 as in
the
effort to be described on this page. Back then the tool set consisted
of a plastic protractor and small ‘pocket’ level; while for try #2, a
digital protractor and larger level were used. It was impossible to
photograph measurement while using the larger implements—not enough
hands. However, in each case the protractor was placed alongside the
‘boom’,
such that the
angle of the boom with respect to the horizon (bubble level)
could be
measured after each adjustment. The mounting mechanism, inherited from
the old DirecTV setup, displayed the same angle measure, and agreed
within a degree or so with protractor readings.
To adjust antenna
elevation angle, I used essentially the same procedure in 2018 as in
the
effort to be described on this page. Back then the tool set consisted
of a plastic protractor and small ‘pocket’ level; while for try #2, a
digital protractor and larger level were used. It was impossible to
photograph measurement while using the larger implements—not enough
hands. However, in each case the protractor was placed alongside the
‘boom’,
such that the
angle of the boom with respect to the horizon (bubble level)
could be
measured after each adjustment. The mounting mechanism, inherited from
the old DirecTV setup, displayed the same angle measure, and agreed
within a degree or so with protractor readings.
For the 2018 attempt to receive the GOES
satellite I used a 50 foot (15 meter) run of ordinary high-frequency
coax (RG-8X) from the antenna and LNA to an RTL-SDR inside the house.
This necessitated constructing an outboard biasTee supply and
interface, as the particular RTL-SDR used then was not capable of
supplying biasTee voltage. I won’t attempt to
enumerate all the possible reasons for failure of this first try.
Suffice to say that tuning the SDR around the satellite frequency never
once produced a whisper.
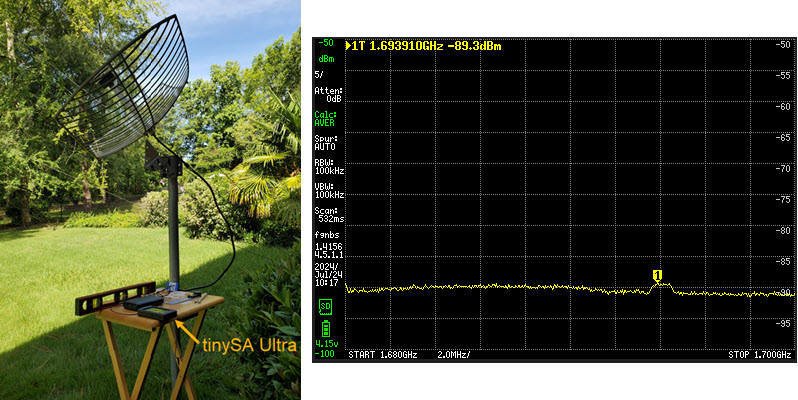
Try #2 (2024): This second attempt to receive
and decode GOES-16 was inspired by a simple idea. I had acquired a
tinySA Ultra (handheld spectrum analyzer) and was thinking about one of
its
extremely useful features. TinySA Ultra can be configured to average
successive sweeps, either a fixed number of times or indefinitely.
Averaging cancels most of the noise, causing the tinySA Ultra to
display a nearly flat line reflecting average noise
power. If there is a signal anywhere in the swept spectrum, it
will stand out in the average of many sweeps. The thought was that it
might be possible to detect GOES-16 using tinySA in averaging mode. If
such a try were to succeed, then it should also be
possible to improve the signal by experimentally manipulating anything
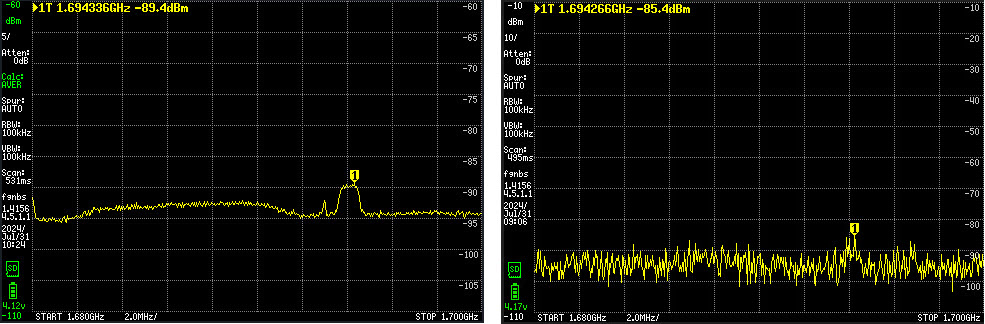
and everything that could be tweaked in the setup. As the above
screen-capture indicates, this sensitive signal detection method did succeed.
Note the 1 to 2 dB bump at the 1694 MHz
GOES frequency. The associated setup photo is
somewhat cluttered, but the antenna connects to a battery powered LNA,
which connects via a short coax jumper to the spectrum analyzer’s
RF input.
Starting from a small bump in the tinySA average of
many sweeps, I tweaked azimuth and elevation and even the spacing
between the secondary reflector and feed (boom), as was suggested in
this informative tutorial. However, inverting the small
reflector made no difference. I did not adjust the antenna’s skew—That
would have been tricky with my makeshift mount adapter. Some
adjustments seemed to help a little, but none made the signal stand out
in real-time (not averaged) sweeps of the 1.68 GHz to 1.7 GHz spectrum.
Having made only marginal progress I began to wonder
about the antenna, whether it was really capable of good reception at a
frequency that was substantially different from its design frequency.
Many others had reported positive results from this antenna, but I had
doubts. Then I did something that may have been foolish. I bought
another antenna.
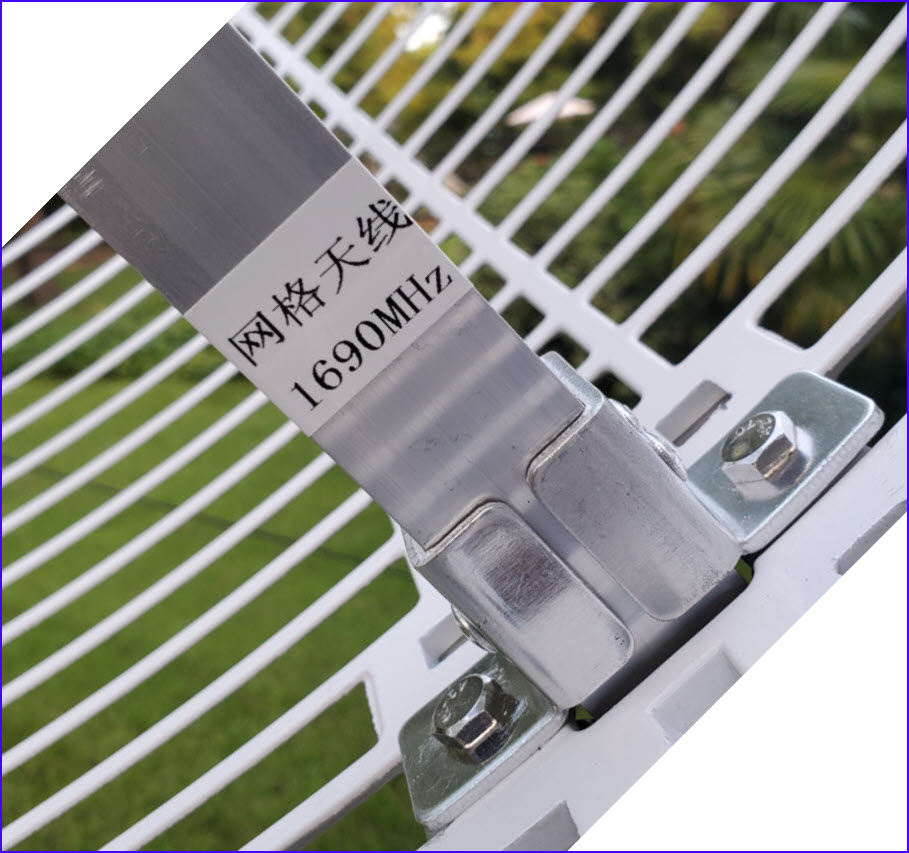
The Nooelec GOES
antenna from Amazon advertised a center frequency of 1.7 GHz and
the label on the boom clearly confirmed this
advertised specification, although my nanoVNA rendered a different
opinion...
Nevertheless I proceeded to substitute this antenna for testing. The
Nooelec appeared physically identical to the ZDA 1.9 GHz dish. The
mount attachment was the same, so it was an easy swap.
In spite of my pessimism the signal was unmistakably
better from the Nooelec antenna, other things being equal. In fact the
GOES signal could also be seen in a real time sweep (right image
above). Knowing a signal was there (marker 1) might have helped. At
last there was hope of receiving something from GOES, probably not
much, but possibly a proof of concept. It was time to substitute an SDR
for the tinySA.
Receiving and Decoding: Up to this
point I had given little thought to the
next phase. I was only dimly aware of various software options for
decoding GOES transmissions. My thought was to run the LNA output to an
SDR on the desktop computer, using RG-8X coax, like in the 2018 try.
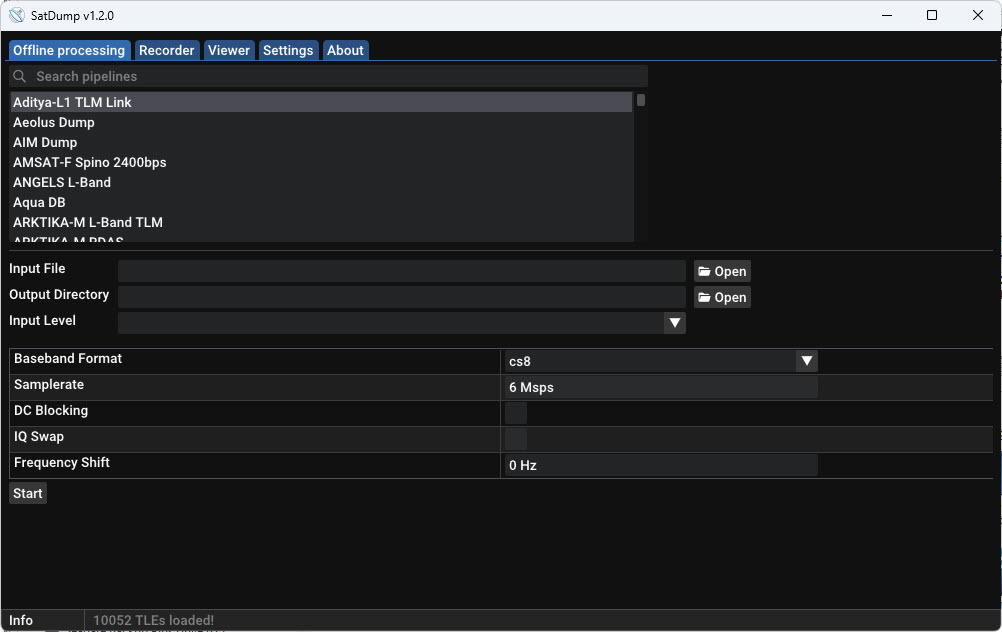
Anticipating this approach I installed SatDump
on the computer (screenshot above), but continued to seek and
read additional information on the general subject. This background
research led to another fantastic resource: https://usradioguy.com/receiving-goes-hrit-with-satdump.
Among its many useful suggestions, this article advises to install
SatDump
on a Raspberry Pi. Immediately I realized that doing this would
eliminate the need for a coax run between the antenna and my desk (or
anywhere). With luck it would be possible to place the Raspberry Pi
outside next to the antenna and operate the program via an SSH terminal
connection.3 Several Raspberry Pi’s
were on-hand, so I picked one to use for this purpose.
Following guidance from the ‘usradioguy.com’ web
page, I built a Raspberry Pi-3B command-line SatDump install on a small
capacity microSD. GOES data (if any were received) could be transferred
to my desktop from the microSD, thus not burdening the Pi with any
appreciable data storage requirement. I didn’t expect to receive much
data. In truth, I didn’t expect to receive any image data, imagining that the
signal was simply not strong enough.
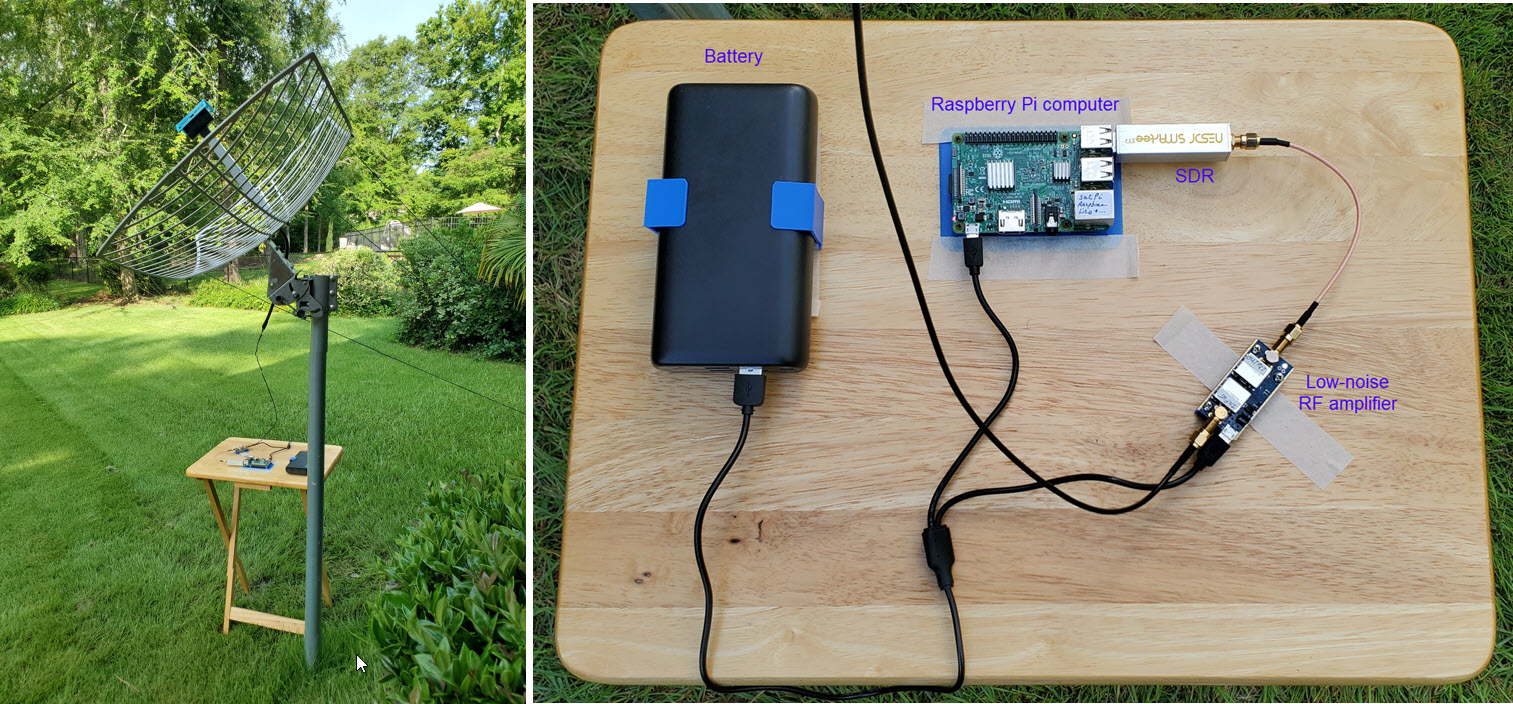
To my astonishment the very first test run of the
remote Raspberry Pi setup pictured above produced many clean text files
and several partial images. Some smaller images were nearly
intact. In the previous tinySA testing phase I had used three different
LNA / SAW filters, procured at different times in the past. One of them
seemed to produce relatively the same signal to noise at a few dBm
lower that the other two, which were indistinguishable from one
another. There would be no harm trying the one with lower power output
in the data acquisition setup. After making this substitution I got
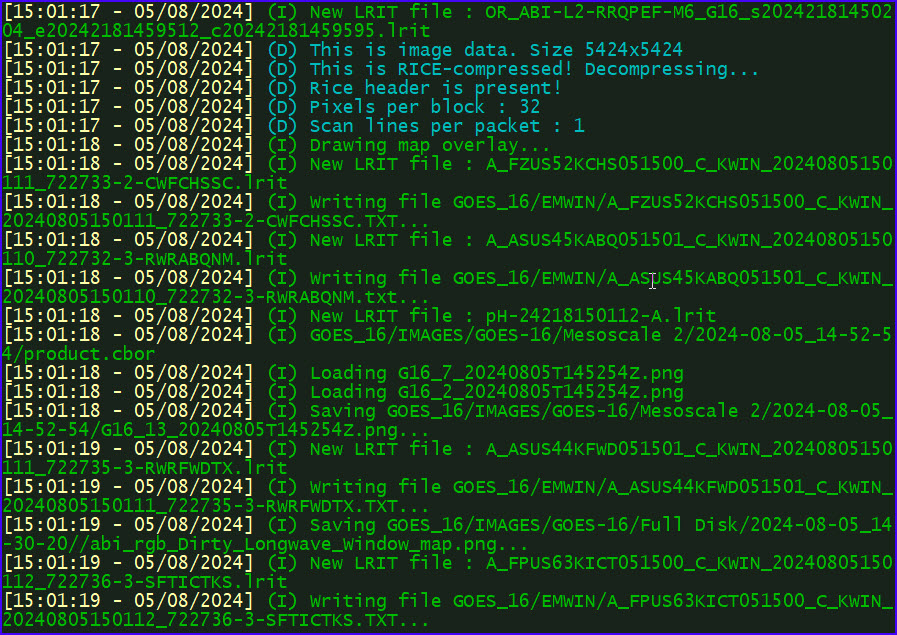
nothing at first. However, informational messages from SatDump
suggested that the gain was too low. On increasing gain, a miraculous
result occurred. Decoding became error-free. All those red lines were
gone from the SatDump log. Even the largest high-resolution images were
perfect. How could that be?
Before this first data acquisition run with the
lower-output LNA/SAW filter, I had made a list of five things to try
for
improving the signal. Now there was no need to proceed to item #2 on
the list. After making one single change, the LNA/SAW filter swap,
SatDump reported zero errors. This performance was sustained in
many hours of additional decoding, over more than a week. (One
red line displays on first starting the program, where it begins to
receive data at a random point, e.g., in the middle of a file—after
that, few or no additional errors.) A typical data acquisition session
lasts
about 80 minutes (an arbitrary interval), during which time voluminous
data are acquired—too much to review meaningfully. In addition to
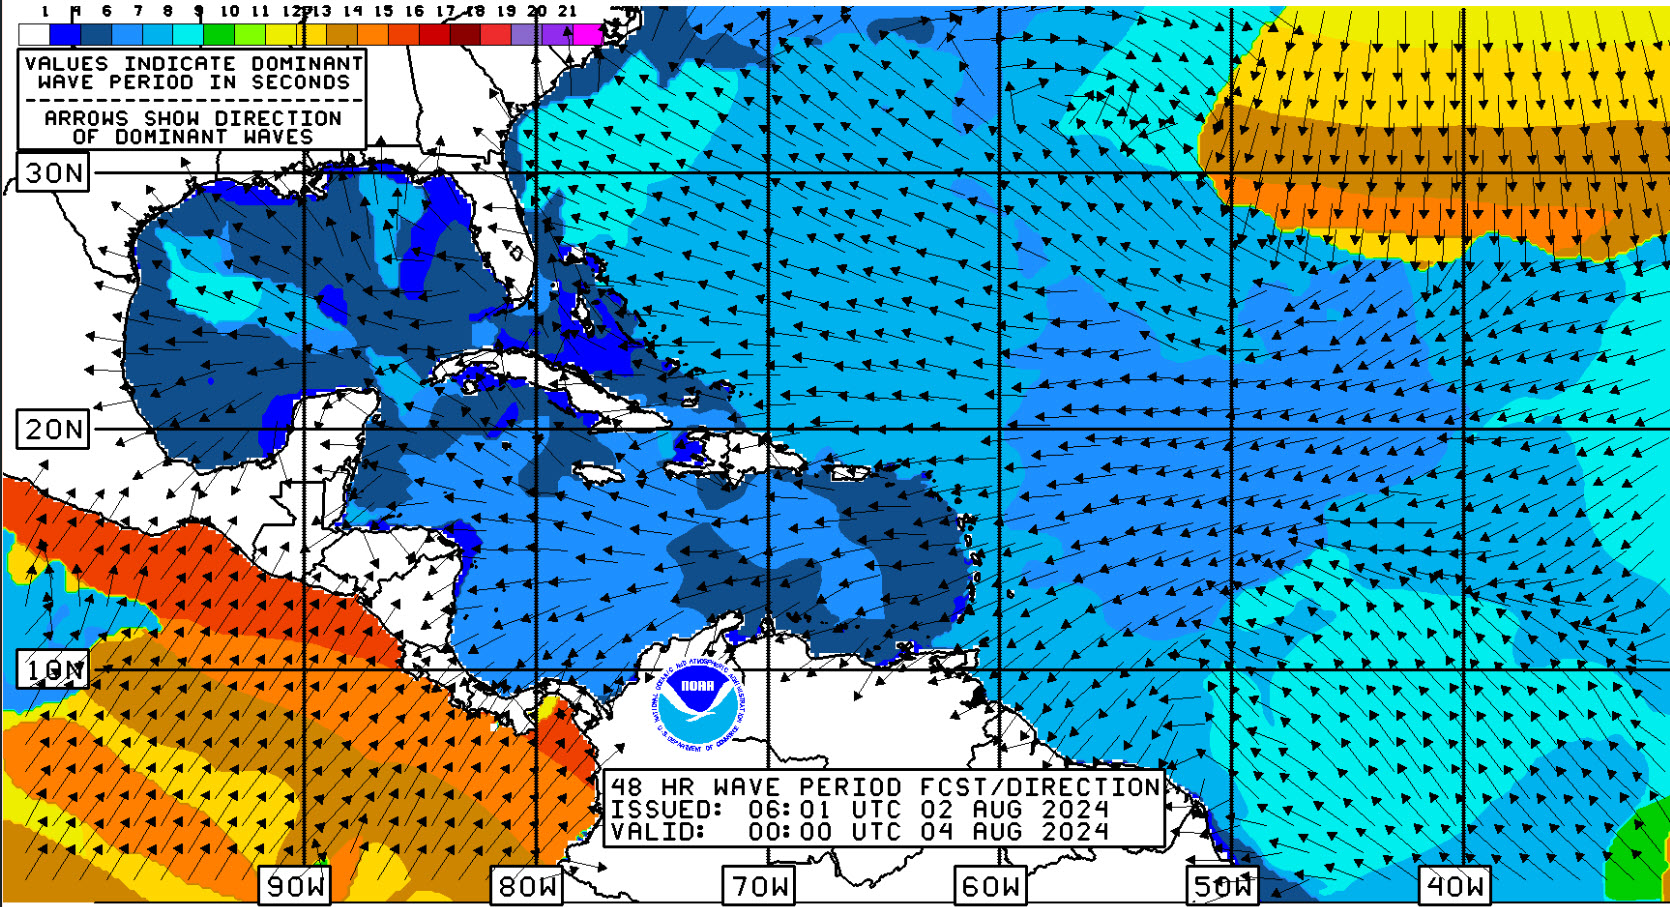
hundreds of forecasts and satellite acquired photo images there
are also National Weather Service charts, such as the colorful example
below.
The quantity of data received and decoded would
resist meaningful analysis and review, except by meteorological
professionals, certainly not by me. TV weather forecasts and
our backyard weather station provide entirely satisfactory practical
information. The appeal of acquiring forecasts and
beautiful images directly from the NOAA GOES satellite is not so much
for their usefulness as for the satisfaction of having made the
exercise work. For the most part I have merely followed ideas and
suggestions published on-line by others. Still this NOAA GOES project
was a challenge, and one that yielded a pleasing reward for modest
investment.
Addendum 1: A folding table with taped-on components is
of no use when it is raining. I was curious whether GOES data would be
received through the rain and
clouds of tropical storm Debby, which meandered slowly northward, close
to our location on August 8, 2024.
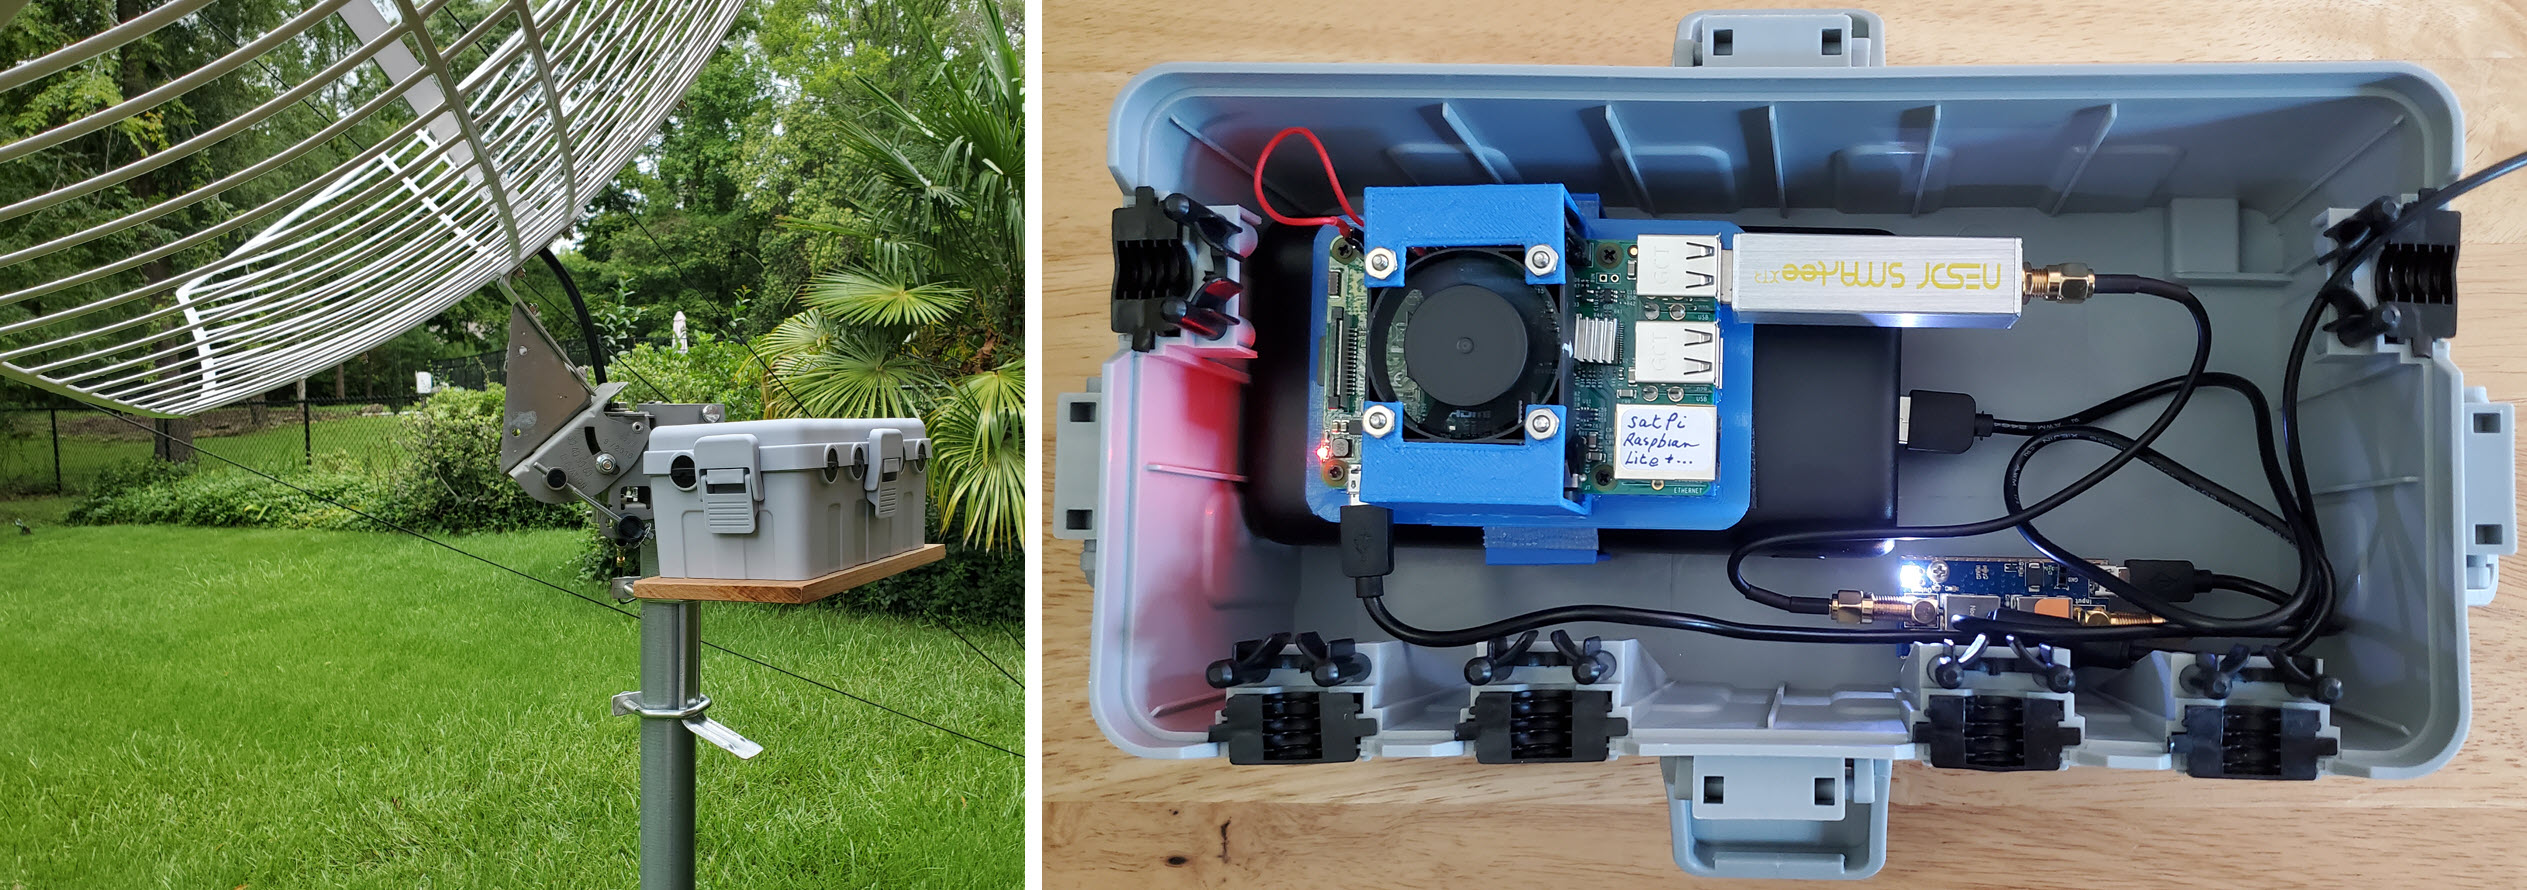
The dry box is approximately 10½ inches long × 5½
inches wide by 5 inches in height. There is plenty of room for GOES
project components. However, short coax jumpers are stiff and awkward
to fit, so
I used a longer more flexible jumper between the
LNA and SDR. The fan in the photo is another story. It was not needed
on August 8, when the temperature was 72° F. (22° C.)—I will
return to the cooling concern.
Rain fell for 24 hours, sometimes heavy, other times
light. In early afternoon this high-resolution image of the hemisphere was
received. Both Debby and Emilia (Pacific storm) are clear in
the zoom-able image, which was timestamped 16:30 UT on August 8, 2024.
The antenna is situated near the south wall
of the house, leaving the dry box in shade until early afternoon. Of
course, when it is not raining, the top can be
left off the box. Nevertheless, it seemed
prudent to take steps to prevent overheating the electronics.
Unfortunately I
know nothing about the technicalities of cooling. Intuitively, though,
it
would be necessary to exchange air between
inside and outside the sealed box.
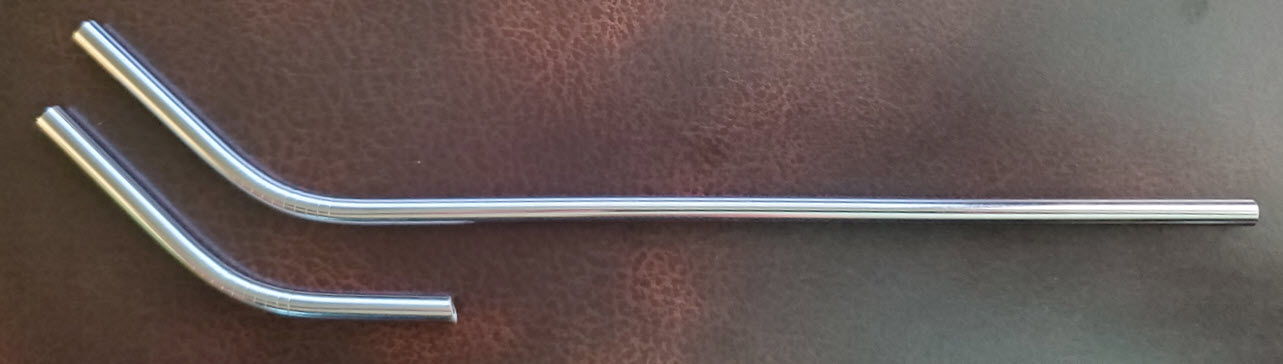
 Drinking straws are about the same diameter as power cords, and should
fit through the dry box’s water-resistant openings. I purloined a pair
of curved steel straws from the pantry and cut one of them with the
Dremel tool to test the idea. The curved piece fit snugly. According
to my admittedly poor intuition about such things, two
cut pieces placed at opposite ends of the box, and turned downward on
the outside, should allow moving air to pass out- or in- when the lid
is shut. This whole cooling business may be a pseudo-concern, as rain
falling on the lid must surely cool the inside air; and, as noted, if
rain is not expected, the box can be left open.
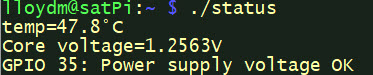
In any case, it is also reassuring that the Raspberry Pi has built-in
sensing of core
voltage and temperature. —I made a convenience script to format and
display these
parameters (image left).
Drinking straws are about the same diameter as power cords, and should
fit through the dry box’s water-resistant openings. I purloined a pair
of curved steel straws from the pantry and cut one of them with the
Dremel tool to test the idea. The curved piece fit snugly. According
to my admittedly poor intuition about such things, two
cut pieces placed at opposite ends of the box, and turned downward on
the outside, should allow moving air to pass out- or in- when the lid
is shut. This whole cooling business may be a pseudo-concern, as rain
falling on the lid must surely cool the inside air; and, as noted, if
rain is not expected, the box can be left open.
In any case, it is also reassuring that the Raspberry Pi has built-in
sensing of core
voltage and temperature. —I made a convenience script to format and
display these
parameters (image left).
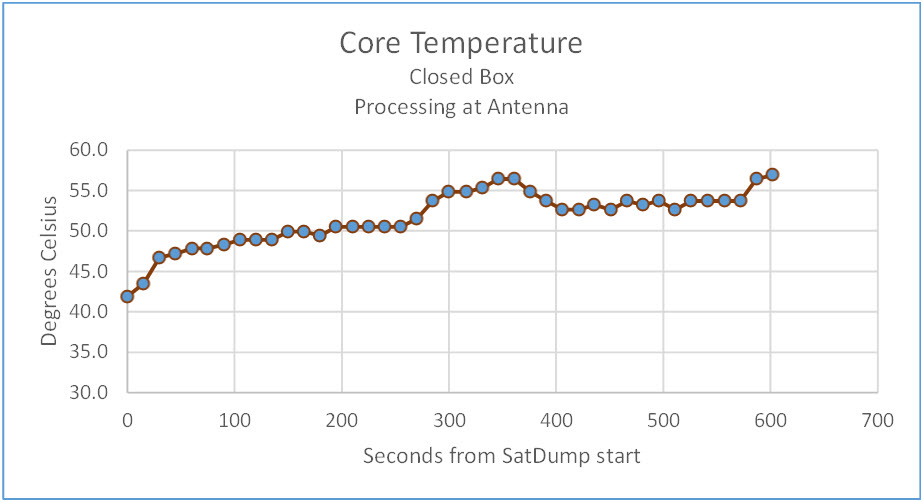
According to the Linux top command, SatDump accounts for
nearly 100% CPU when processing data from the SDR in real time. The
graph above shows temperature increasing over the first 10 minutes of
an example run, after which it stays around 60° C. for the remainder
of the session—Pi core is hot at 100% CPU.
Outside air temperature was about 90° F. (32° C.) and the sun was
beaming directly on the closed dry box. However, I don’t think outside
temperature matters a whit. What matters is processing demand. After
stopping SatDump, temperature quickly dropped to about 37°
C. and hovered around that value, even as the box remained in the sun.
Finally, as
far as I could tell, there was no appreciable air exchange between
inside and outside the box. My refrigeration engineering career is
on hold.
Demo video: My Goes Setup
Addendum 2:
GOES-16 transmits a ‘full disk’
image every half hour. My satellite reception/decoding sessions
generally last one to one-and-a half hours, sufficient time for two or
three high-resolution hemispheric images and a great many other files
to be received.
Full disk images showed more or less of the hemisphere in daylight,
depending on the time of
day each was acquired. The image timestamped 2100 UT seemed entirely in
sunlight. At that time no dark segments are seen, either east or west.
I began to think of collecting a full day of images, from
daybreak to dusk. Such a sequence would show the progression of
sunlight across the hemisphere, as earth and the geostationary
satellite turn.
Regrettably, the small capacity Raspberry Pi microSD
did not have
enough storage to accommodate a full day's data. I could have plugged a
thumb drive into one of the Pi’s four USB-A sockets, but elected
instead to build a fresh OS and application install on a 64 GB microSD.
On September 2, 2024, (Labor Day in the United States) I started
SatDump just before 5 AM local time (0900 UT) and let it run until
after 7:00 PM (2300 UT). Local weather was mixed, partly sunny but with late afternoon rain.
During this approximately 14-hour period more than 20,000 files (9.5
GB) were acquired. The data included 28 half-hourly full-disk images.
All were error-free.
The next day I converted the 28 images to a lower
resolution format and copied them to a video editor, in order to
experiment with various presentation parameters. For example, I
imagined a small analog clock in one corner (picture-in-picture), with
hour and minute hands indicating the time of each image. However, when
this idea was tested, the clock diverted attention from the satellite
images and had to be discarded. I also tested different presentation
durations, finally settling on three seconds per image. This was a
subjective assessment, of course. Three seconds felt comfortable and
made it easy to align the sequence with the selection of music that I
had in mind to use.
Demo video: Labor Day 2024
1. I have also uploaded a wallpaper version of
the image for 1024 pixel vertical resolution screens.
Right-click, SaveAs, etc. At the time this image was received it was
still night over the Pacific Ocean (leftmost part of disk). However,
the Raspberry Pi was barely in the shade and at 11 AM EDT (1500Z) the
temperature was already 90° F (32° C). The Pi might not fare well in
blazing summer sun. Keeping it cool outside will be a project for later.
2. The screen capture image inadvertently omits a
copyright notice “Imagery ©2024 Airbus, Maxar Technologies” that was
present in the original DishPointer image, but not in the full-screen
version.
3. The Raspberry Pi at the antenna location had a
reliable WiFi connection to the LAN router (opposite end of house),
without the aid of a WiFi extender. This good fortune was also
unexpected!
Project descriptions on this page are intended for entertainment only.
The author makes no claim as to the accuracy or completeness of the
information presented. In no event will the author be liable for any
damages, lost effort, inability to carry out a similar project, or to
reproduce a claimed result, or anything else relating to a decision to
use the information on this page.